Statistics for Instagram Stories
Analyze statistics, improve stories, reach a larger audience and increase engagement.


What Instagram stories statistics LiveDune can provide
Audit of Instagram stories will help you inspect your results and distribute content creation efforts. Leverage the real statistics to find what story content delivers the best results and what needs improvement. LiveDune will help you with that. Read along to learn what statistics you can access.
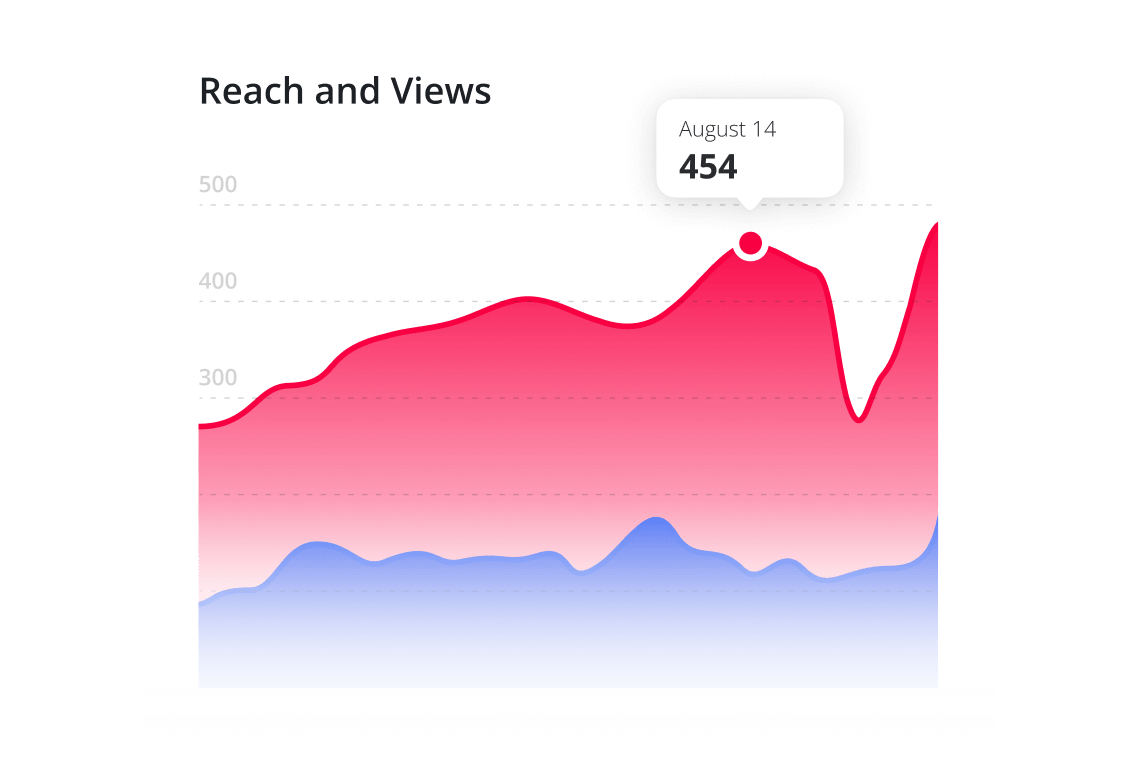
Story views and reach
These metrics reflect how interesting your Instagram stories are to your followers. By analyzing views and reach of your Instagram stories, you can see the general performance. If the indicators are growing, go on in the same vein. If you see them decline, content you share might be irrelevant: revisit it and adjust your content plan.

Top stories
Analyze your Instagram stories against 7 metrics (format, views, reach, responses, taps back, closes, taps forward, completion rate, and reach rate). For instance, tap and response data will help you identify the most relevant stories that generate the best feedback. Such stories will contribute to audience activity and reach, so double down on creating similar ones.
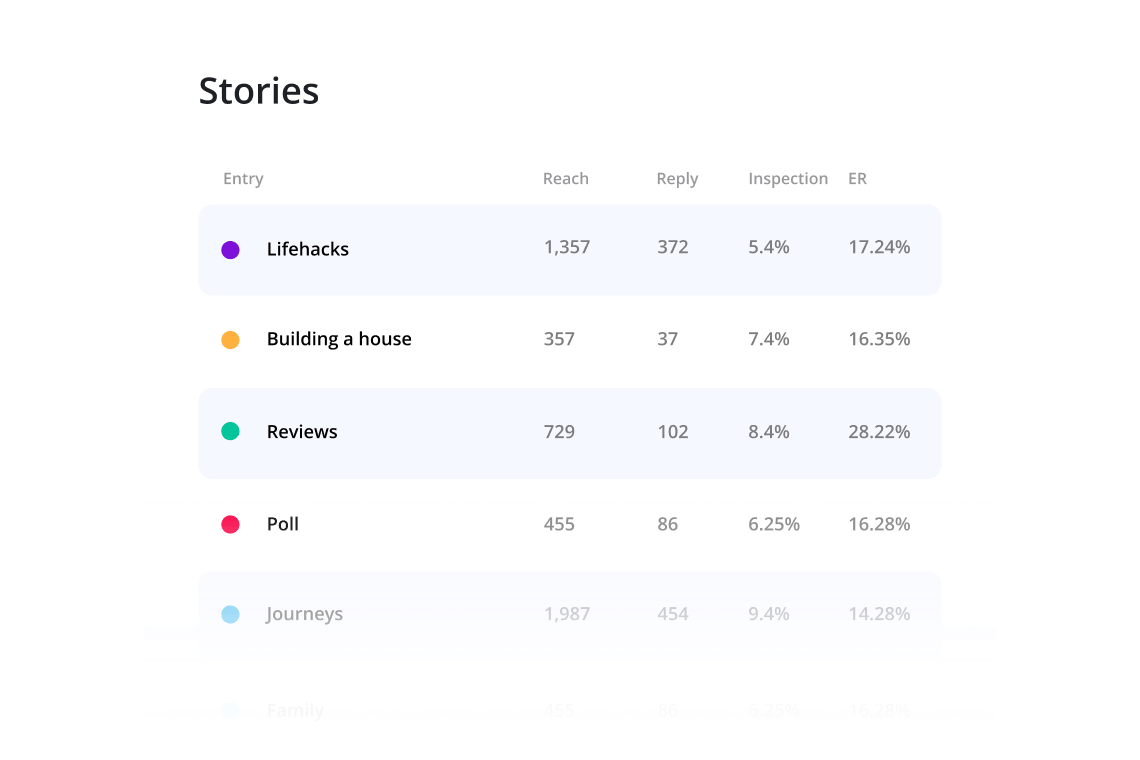
Story analysis by category
To evaluate Instagram story performance, analyze reach, responses, completion rate, and reach rate of each category. This will help you identify top and worst performing story categories. Categories that see poor reach, few responses, and low completion rate might need significant improvements or another format. Or you may ditch them and start testing new categories. With regular performance analysis, you’ll maintain high audience activity and grow your reach.
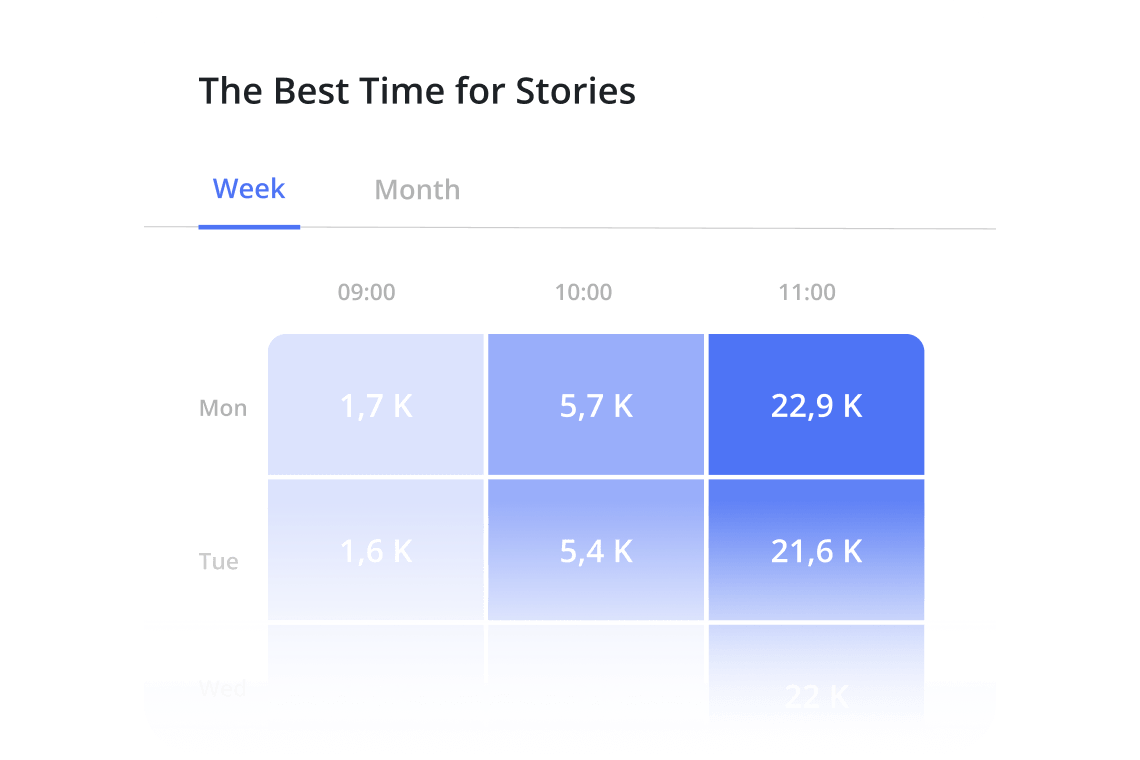
Best time to publish stories
The service will show you the statistics on hours and week days when you published stories. Pick days and hours when most people watch your stories. Sharing content in these hours, you get a higher chance to secure a broader reach.
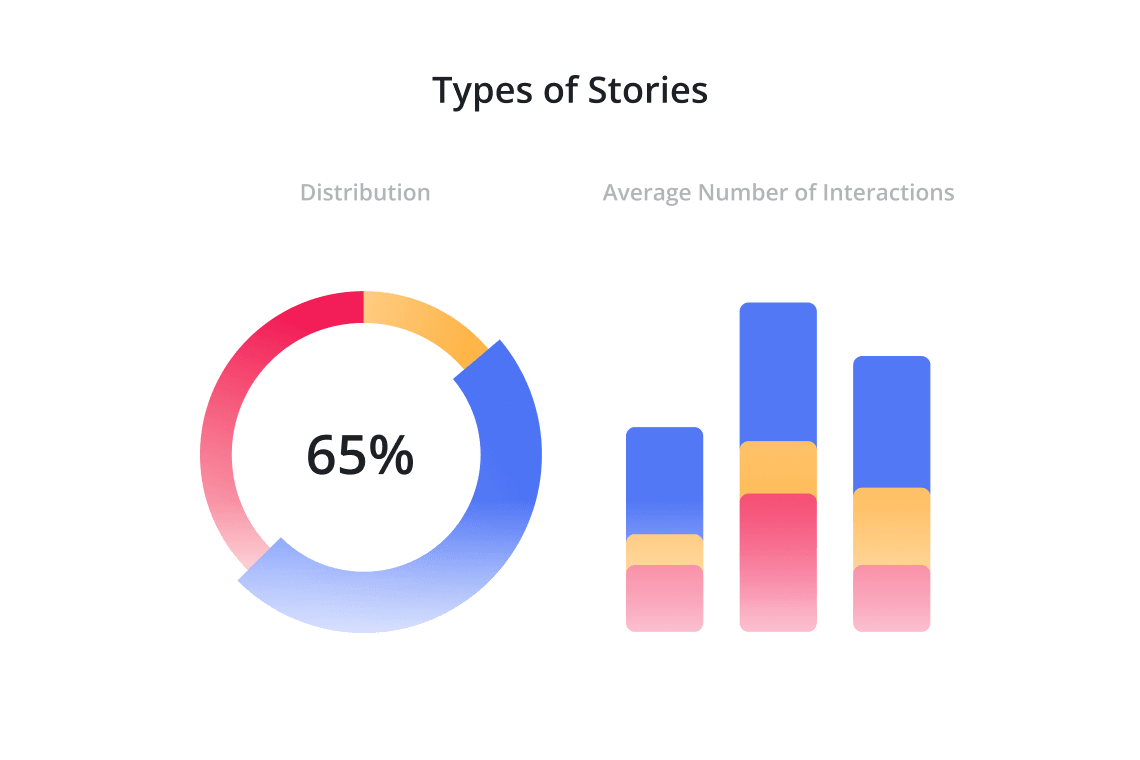
Performance of various types of Stories
One of the growth points in improving Instagram story reach and audience activity is analyzing every type of story content (image, video, shared story). For example, you published 5 images but they saw twice as few responses as three videos. If you double down on posting videos of the same quality, chances are you’ll boost story reach and activity.
Our Products
Analyze your content strategy and keep track of your competitors’ metrics.


FAQs
Why can’t I see the statistics of my Instagram Stories?
There are two possible reasons. Either the Corporate Account hasn’t been enabled, or the app is out of date.
What do Stories statistics mean?
Each chart has a question mark button next to it. Click it to learn more about all metrics and how this chart can benefit you.
How do I view story statistics?
Connect your account to LiveDune and start collecting comprehensive historical statistics from the moment the account is connected.
What clients say:

Viktoria Chachelova

Andrey Mazur

Andrey Komissarov

Irina Minayeva

Ivan Ilyin

Stanislav Son

Evgeny Skvortsov

Kseniya Kozhemyakina

Kseniya Vezhichanina

Aleksandr Litvin

Kate Fedorenko

Polina Malakhova

Alex Tkachuk

Artyom Sadovnikov

Krystin Aidumova

Max Yurin
Boost the effectiveness of your content promotion on social media
Sign up and get free access for 7 days.